
Interactive Python Dashboards, Powered by AI & Python
Uncover financial insights in real-time — without drowning in spreadsheets or writing a single line of code.
At Infitarit, we believe data should empower you, not overwhelm you. That’s why we built a powerful, Python-driven analytics dashboard designed to turn complex financial data into intuitive, decision-ready visuals. Whether you’re an investor tracking volatile markets, a business owner navigating inflation, or a data analyst scanning global trends — this tool was built for you.
✅ Effortless, Real-Time Data Visualization
Make smarter decisions with real-time data presented clearly and beautifully.
Our dashboard pulls together multiple data sources — from financial APIs to custom data files — and presents them in an elegant, interactive format that’s easy to explore.
🔹 Compare Economic Trends: Analyze GDP, inflation, employment rates, and more across countries and regions.
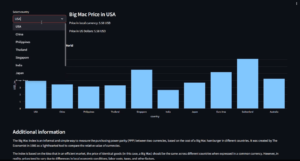
🔹 Dynamic Graphs & Tables: Visualize data using responsive charts, sortable tables, and exportable reports. Adjust filters, select specific time frames, and zoom in on key trends instantly.
🔹 Currency & Inflation Monitoring: Keep tabs on real-time currency exchange rates and inflation data from global sources.
🔹 AI-Driven Visual Insights: Surface outliers, growth opportunities, or market risks automatically, using smart recommendations powered by AI.
🔹 Customize your view with light/dark themes and save preferred dashboard layouts for repeated use.
✅ Built-In AI That Does the Thinking for You
Why spend hours crunching numbers when AI can do it in minutes?
Our integrated AI engine helps you uncover insights faster by running intelligent analyses on your financial data.
🔹 Auto-Detect Patterns: Identify trends, anomalies, and correlations across massive datasets — with zero manual analysis.
🔹 Smart Recommendations: Get suggestions on when to buy, sell, hold, or investigate anomalies, based on predictive models.
🔹 Constantly Improving: Our AI adapts and optimizes over time, cutting analysis time from 30 minutes to just a few seconds.
🔹 Flexible Deployment: Choose between running the AI locally for privacy, or on the cloud for maximum performance and accessibility.
✅ Built for Speed, Flexibility & Growth
Adaptable to your workflow. Scalable to your ambition.
Whether you’re working with historical datasets or streaming live financial feeds, our dashboard adapts to your pace and preferences.
🔹 Upload Your Own Data: Excel, CSV, Google Sheets, MySQL databases — import anything and start analyzing immediately.
🔹 Live Crypto Tracking: Monitor cryptocurrency price movements in real-time with updates every 30 seconds.
🔹 Data Automation Ready: Integrate web scraping tools to auto-refresh dashboards with the latest market or economic data.
🔹 Custom API Dashboards: Define your own indicators, thresholds, and alerts — no hard-coding required.
Built with Python and React, the platform delivers lightning-fast performance, cross-device compatibility, and smooth scaling for teams of any size.
🔥 Why This Matters More Than Ever
In today’s data-saturated world, what separates the successful from the struggling is speed — speed to insight, speed to strategy, speed to action.
Our dashboard isn’t just a tool — it’s a business advantage. From investment firms to fintech startups to economic research teams, Infitarit’s solution empowers organizations to:
✅ Reduce manual analysis time
✅ Increase decision accuracy
✅ Spot opportunities faster
✅ Adapt to real-time market shifts
✅ Collaborate across teams with unified dashboards
🔥 Ready to See It in Action?
✅ Let’s explore how Infitarit’s interactive dashboard can be customized to solve your data challenges and drive smarter decisions.
✅ Contact us today — and let’s unlock your financial intelligence.